TranscriptionPath ChIP-Seq Service Overview
Active Motif’s TranscriptionPath™ ChIP-Seq Service provides an alternate approach to RNA-based methods to study gene expression. TranscriptionPath is a chromatin immunoprecipitation-based assay used to measure transcription rates as a function of RNA polymerase II occupancy across the genome. Unlike other RNA-based techniques, the method enables you to measure transcription rates without the influence of RNA half-life. Our TranscriptionPath ChIP-Seq Services also offers the added advantage of using the same material that is used in other transcription factor or histone modification targeted ChIP-Seq experiments, allowing you to correlate transcription factor binding and epigenetic modifications with transcriptional changes in the same experiment.
The TranscriptionPath ChIP-Seq Service includes:
Customers submit frozen tissues or cell pellets, then we:
- Prepare chromatin samples and sonicate.
- Perform ChIP with a highly validated RNA Pol II antibody.
- Prepare ChIP-Seq libraries.
- Perform next-generation sequencing using the Illumina platform.
- Analyze the data and deliver it to the customer.
To learn more, read the TranscriptionPath Applications Note or send us an Epigenetic Services Information Request. You can also download Active Motif’s Epigenetic Services Brochure.
Advantages of using our TranscriptionPath ChIP-Seq Service to measure gene expression
- Measure transcription rates without the influence of RNA half-life.
- Ideal for measuring changes in gene expression at early time points (minutes).
- Detect alternate start sites and unannotated genes.
- Identify genes that are poised for transcriptional activation.
- Perform in parallel with transcription factor-targeted ChIP to correlate TF binding with changes in transcription.
TranscriptionPath ChIP-Seq Service Data
TranscriptionPath ChIP-Seq Service Can Detect Changes at Early Time Points
Changes in gene expression can occur within minutes of cell treatment, but these changes are often not detected because most methods to investigate gene expression, such as RNA-Seq, measure only much later time points. To truly understand the molecular mechanisms responsible for mediating a cellular response it is important to understand the changes that are happening at the earliest times possible after the treatment. Measuring mRNA at these early time points has limitations because large transcripts can take over an hour to be transcribed, processed, and exported to the cytoplasm where they can be detected. The TranscriptionPath ChIP-Seq Service can detect gene expression changes that are missed by mRNA detection methods because it measures RNAPII occupancy on DNA in real time.
The examples in the figure below show that the TranscriptionPath-qPCR assay is more robust than RT-qPCR and can also detect changes in gene expression earlier in the time course than mRNA measurements by RT-qPCR.
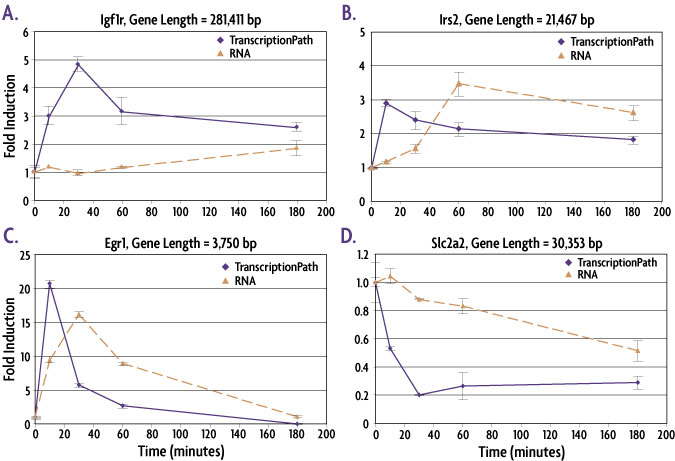
Figure 1: TranscriptionPath™ is better than RT-qPCR at detecting changes in gene expression at early time points.
Mouse Min6 cells were treated with forskolin to induce changes in gene expression. Cells were fixed, chromatin prepared and TranscriptionPath-Seq analysis performed using qPCR primers approximately 1500 bp 3′ of the transcription start site (TSS). Total mRNA was measured by preparing cDNA and designing primers that span splice junctions. Igf1r (A), Irs2 (B) and Egr1 (C) are all genes for which induced transcription was detected. For all of these genes the peak in transcription is detectable before the peak in mRNA and the data shows that the longer a gene is, the farther the peak in mRNA lags behind the peak in transcription (compare A to C). TranscriptionPath also enables earlier detection and more dramatic differences for the down-regulated gene Slc2a2 (D) with the most dramatic decrease in transcription observed at 30 minutes compared to 3 hours for RT-qPCR measurements.
TranscriptionPath ChIP-Seq in Combination with FactorPath™ ChIP-Seq
ChIP-Seq is a widely-used method to detect transcription factor binding across the entire genome. However, mapping binding transcription factor binding sites alone lacks contextual information because the process of TF binding does not always lead to transcriptional activation or repression. To more fully understand the importance and/or function of individual TF binding events, it is necessary to understand the effects of TF binding on transcription of each bound gene. This type of analysis can be achieved by integrating transcription factor ChIP-Seq data from our FactorPath ChIP-Seq Service with TranscriptionPath ChIP-Seq gene expression data.
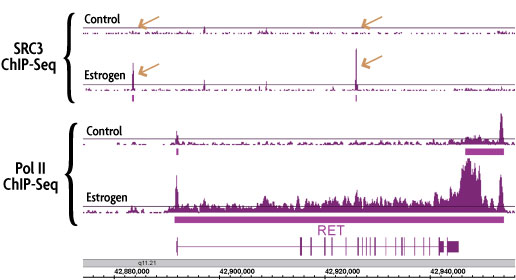
Figure 2: Induced TF binding correlates with TranscriptionPath™ ChIP-Seq Service gene expression data.
Performing ChIP-Seq using an antibody against RNA Pol II produces a genome-wide profile of RNA pol II occupancy. ChIP-Seq was performed using chromatin from control and estrogen-treated MCF-7 cells and antibodies against RNA Pol II and the estrogen-inducible transcription factor SRC3. Estrogen treatment induced the binding of SRC3 at the promoter and gene body of the RET gene (copper arrows in top 2 panels). Induced SRC3 binding correlates with induced transcription of the RET gene as measured by our TranscriptionPath ChIP-Seq Service (bottom 2 panels).
TranscriptionPath ChIP-Seq Service Can Identify Alternate Start Sites and Unannotated Genes
30-50% of all human genes use alternate transcription start sites in addition to their primary promoter. Using the TranscriptionPath ChIP-Seq Service method for gene expression studies has the added advantage of providing information on transcription start sites (TSSs). These alternate TSSs can occur within the existing annotation or far upstream of the annotated start site. The identified alternate TSS can often be verified by searching additional gene databases. Additionally, the TranscriptionPath ChIP-Seq Service has the ability to detect transcription of unannotated genes. The two examples below illustrate ways in which TranscriptionPath ChIP-Seq Service data is rich in additional biological information that goes beyond simply measuring transcription rates.
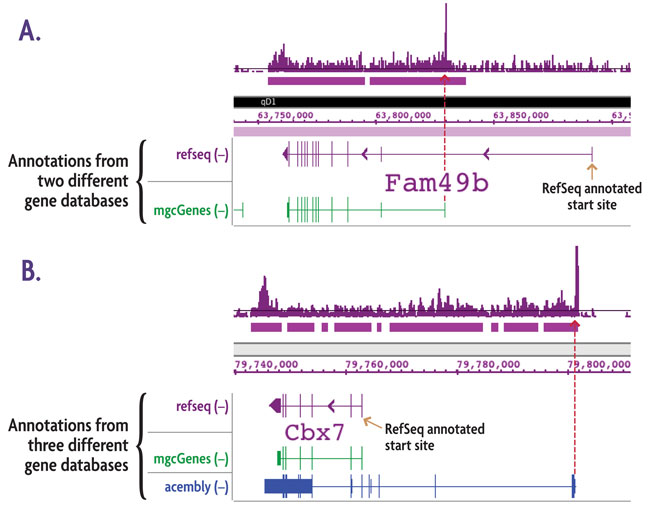
Figure 3: Alternate transcription start sites (TSSs) revealed by TranscriptionPath™ ChIP-Seq Service.
TranscriptionPath ChIP-Seq was performed using chromatin from a mouse neuroblastoma cell line. The data presented here is from two genes with transcription initiation in areas of the genome that do not correspond to their respective start sites in the RefSeq gene database (purple gene annotations). A. Comparison to an alternate gene database (mgcGenes, green gene annotation) reveals a known alternative transcription start site for Fam49b that corresponds to the transcription start site detected by the TranscriptionPath ChIP-Seq Service. B. Comparison to the RefSeq and mgcGenes databases shows the same annotations for Cbx7, but comparison to a third gene annotation database (Acembly Genes, blue gene annotation) reveals a known alternative start site for Cbx7 that corresponds to the transcription start site detected by the TranscriptionPath ChIP-Seq Service. The red arrows show that the start sites from the alternate gene databases correspond precisely with location of paused RNAPII.
TranscriptionPath ChIP-Seq Service Documents
TranscriptionPath ChIP-Seq Service Sample Submission Portal
Our online sample submission portal allows you to easily upload your service project samples and track your project status. Follow the sample submission instructions in the portal to ensure that all your samples arrive at Active Motif in the best possible condition and properly associated with your project.
You might also be interested in:
| Name | Cat No. | Price | |
|---|---|---|---|
| TranscriptionPath™ ChIP-Seq | 25220 | Get Quote |
Advantages of using TranscriptionPath to measure gene expression
- Measure transcription rates without the influence of RNA half-life.
- Ideal for measuring changes in gene expression at early time points (minutes).
- Detect alternate start sites and unannotated genes.
- Identify genes that are poised for transcriptional activation.
- Perform in parallel with transcription factor-targeted ChIP to correlate TF binding with changes in transcription.
TranscriptionPath can detect changes at early time points
Changes in gene expression occur within minutes of cell treatment but these changes are often ignored because most gene expression studies measure only much later time points. In order to truly understand a cellular response it is important to understand the primary response, that is, the changes that are happening within minutes of treatment. Measuring mRNA at these early time points has limitations as transcripts over 100 Kb will take over 1 hour to be fully transcribed, processed and exported to the cytoplasm where they can be detected. The TranscriptionPath method can detect gene expression changes that are missed by mRNA detection methods because it measures RNAPII occupancy at DNA in real time.
The examples in the figure below show that the TranscriptionPath-qPCR assay is more robust and can detect changes earlier in the time course than mRNA measurements by RT-qPCR.
Figure 2: TranscriptionPath™ is better than mRNA methods at detecting changes in gene expression at early time points.
Mouse Min6 cells were treated with forskolin to induce changes in gene expression. Cells were fixed, chromatin prepared and TranscriptionPath-Seq analysis performed using qPCR primers approximately 1500 bp 3′ of the transcription start site (TSS). Total mRNA was measured by preparing cDNA and designing primers that span splice junctions. Igf1r (A), Irs2 (B) and Egr1 (C) are all genes for which induced transcription was detected. For all of these genes the peak in transcription is detectable before the peak in mRNA and the data shows that the longer a gene is, the farther the peak in mRNA lags behind the peak in transcription (compare A to C). TranscriptionPath also enables earlier detection and more dramatic differences for the down-regulated gene Slc2a2 (D) with the most dramatic decrease in transcription observed at 30 minutes compared to 3 hours for RT-qPCR measurements.
TranscriptionPath in combination with TF ChIP
ChIP is widely used to detect transcription factor binding or histone modifications. ChIP-Seq is a combination of ChIP followed by Next-Gen sequencing that enables TF binding and modified histone occupancy to be be mapped across the entire genome. However, mapping binding sites lacks contextual information because the process of TF binding does not always lead to transcriptional activation or repression. In order to more fully understand the importance and/or function of individual TF binding events it is necessary to understand the effects of TF binding on transcription of each bound gene. This type of analysis can be achieved by integrating ChIP-Seq data with TranscriptionPath-Seq gene expression data.
Figure 3: Induced TF binding correlates with TranscriptionPath™-measured gene expression.
Performing ChIP-Seq using an antibody against RNA pol II produces a genome-wide profile of gene transcription rates. ChIP-Seq was performed using chromatin from control and estrogen-treated MCF-7 cells and antibodies against RNA Pol II and the estrogen-inducible transcription factor SRC3. Estrogen treatment induced the binding of SRC3 in the promoter and gene body of the RET gene (copper arrows in top 2 panels). Induced SRC3 binding correlates with induced transcription of the RET gene as measured by TranscriptionPath (bottom 2 panels).
TranscriptionPath can identify alternate start sites and unannotated genes
30-50% of all human genes use alternate transcription start sites. Using the TranscriptionPath method for gene expression studies has the added advantage of providing information on transcription start sites (TSSs). These alternate TSSs can occur within the existing annotation or far upstream of the annotated start site. Often the identified alternate TSS can be verified by searching additional gene databases. Additionally, TranscriptionPath has the ability to detect transcription of unannotated genes. The two examples below illustrate ways in which TranscriptionPath data is rich in additional biological information that goes beyond simply measuring transcription rates.
Figure 4: Alternate transcription start sites (TSSs) revealed by TranscriptionPath™.
TranscriptionPath-Seq was performed using chromatin from a mouse neuroblastoma cell line. The data presented above is from two genes with transcription initiation in areas of the genome that do not correspond to their respective start sites in the RefSeq gene database (purple gene annotations). A. Comparison to an alternate gene database (mgcGenes, green gene annotation) reveals a known alternative transcription start site for Fam49b that corresponds to the transcription start site detected with TranscriptionPath. B. Comparison to the RefSeq and mgcGenes databases shows the same annotations for Cbx7, but comparison to a third gene annotation database (Acembly Genes, blue gene annotation) reveals a known alternative start site for Cbx7 that corresponds to the transcription start site detected with TranscriptionPath. The red arrows show that the start sites from the alternate gene databases correspond precisely with location of paused RNAPII.
The following papers cite the use of and/or provide additional information about TranscriptionPath™ Services provided by Active Motif’s Epigenetic Services:
- “Dynamic O-GlcNAc cycling at promoters of Caenorhabditis elegans genes regulating longevity, stress, and immunity” by Love et al (2010) Proc. Natl. Acad. Sci. USA 107(16):7413-7418.
- “Identification of target genes in breast cancer cells directly regulated by the SRC-3/AIB1 coactivator” by Labhart et al (2005) Proc. Natl. Acad. Sci. USA 102(5):1339-1344.
- “GATA4 expression is primarily regulated via a miR-26b-dependent post-transcriptional mechanism during cardiac hypertrophy” by Han et al (2012) Cardiovasc Res 93(4):645-654.
- “The Transcription Factor Neural Retina Leucine Zipper (NRL) Controls Photoreceptor-specific Expression of Myocyte Enhancer Factor Mef2c from an Alternative Promoter” by Hao et al (2011) JBC 286(40):34893-902.
- “Global Characterization of Transcriptional Impact of the SRC-3 Coregulator” by Lanz et al (2010) Molecular Endocrinology 24(4):859-872.