<< Back to MOTIFvations Blog Home Page
Library QC for ATAC-Seq and CUT&Tag
AKA “Does My Library Look Okay?”
By Michelle Tetreault Carlson, Ph.D. and Marc Paradise
July 9, 2025
Table of Contents:
Introduction
ATAC-seq and CUT&Tag have become immensely popular techniques for probing chromatin structure in recent years. ATAC-Seq enables researchers to detect the locations of open chromatin, nucleosomes, and occupied transcription factors using adapter-loaded Tn5. CUT&Tag reveals protein-chromatin interactions using a target antibody and adapter-loaded pA-Tn5. Both protocols are popular because they are relatively straight-forward to perform and because they result in a sequence-ready library. (For more information on these approaches see the Complete Guide to Understanding and Using ATAC-Seq and the Comprehensive Guide to Understanding and Using CUT&Tag Assays.)
Before moving forward with sequencing, most end users first do quality control on the library. Sequencing is expensive, so laboratories don’t want to proceed unless there is a high likelihood of it resulting in quality data. The final QC step for these methods involves checking both the size distribution and the concentration of the adapter-ligated library fragments. But because many scientists are new to these methods, there is a lot of uncertainty as to what these fragments should look like and how much is required for sequencing.
To make matters trickier, ATAC-Seq and CUT&Tag library traces can vary quite significantly between sample types or from prep to prep. Unlike other types of DNA libraries which typically start with isolated DNA, these libraries are prepared from either intact nuclei or intact cells. Tagmentation of the DNA requires transposome access, through the nuclear or cell membrane, to the chromatin inside. This accessibility can be affected by cell type, cell number, cell health, cell aggregates, and the relative the concentration of transposomes to DNA. The result can be a lot of diversity in the quantity and size of library fragments.
Because of this, the most common question we are asked by customers at Active Motif is “Does this library trace look okay?” While the library trace does give some qualitative information which indicates whether or not to move forward, it’s not always simple or even possible to determine if the sequencing will be successful just by looking at the library. It can give you useful information that can indicate a high likelihood of success, or other times when it might be better to make some modifications to the prep and try again. Below we provide some tips and tricks that our R&D, EpiServices, and Technical Support teams have put together over the last few years for how to analyze your library.
Analyzing Fragment Sizes
To evaluate ATAC-Seq and CUT&Tag libraries we recommend checking the fragment distribution after library amplification, using a DNA fragment analyzer like the Agilent TapeStation with the D1000/D5000 Screen Tape Assay or the Agilent Bioanalyzer with the DNA 1000 Chip. An electropherogram of the fragments gives a nice visual of fragments sizes and their frequency. It’s best to choose an assay that is designed for best resolution under 1000 bp. A resolution of 5000bp is also useful to visualize peaks great than 1500bp which might suggest a sample preparation issue.
Want to learn more about CUT&Tag? Check out our Epigenetics Podcast with Active Motif scientists Casidee McDonough and Kyle Tanguay to learn the technical details of the CUT&Tag protocol and current developments around this method in our R&D Team.
Library QC: ATAC-Seq
In eukaryotic chromatin, nuclear DNA is packaged in nucleosomes, each containing 147 bp of DNA coiled around a histone octamer core, with short 20-90 bp DNA linkers separating each nucleosome. Tight or loose packaging of genes within this chromatin can control whether they are expressed. In regions of chromatin where DNA interacts loosely with histones, or open chromatin, transcription promoters and enhancers can gain accessibility to DNA so that transcription can occur. In regions of chromatin where DNA is tightly bound to histones, or closed chromatin, promoter and enhancer regions are hidden from transcription factors and unable to activate transcription.
ATAC-Seq takes advantage of the fact that adapter-loaded Tn5 also has preferential access to open chromatin DNA, cutting and inserting adapters in the DNA. This can occur anywhere within the 20-90 bp linker region between nucleosomes, creating short fragments <90 bp from within the linker region or larger fragments where nucleosomes are sandwiched between Tn5 cuts in the DNA. This is reflected in the size of the ATAC-Seq library DNA fragments. After library amplification, which adds on the P5/P7 Illumina flow cell adapters plus the indexes, library fragments contain the original DNA insert plus an additional 135 bp from the adapters on each end. This creates library fragments starting at around 200 bp which then increase to around 1000 bp. Because of the periodicity of neighboring nucleosomes, fragments pile up with peaks between 160-200 bp apart. This periodic pattern is generally referred to as nucleosome laddering.
Due to variability in sample type, number of cells, and sample handling, the size and shape of library traces can vary quite a lot. It depends on the cell type, their health, the number of cells, and ratio of transposomes to DNA. The number of nucleosome peaks can vary and depends on how frequently Tn5 is able to cut the DNA. We have found little correlation between the number or the size of peaks and high quality sequencing data.

While nucleosomal laddering may indicate a high-quality library, it is not required when profiling open chromatin. In fact, attempting to achieve nucleosome laddering can sometimes be counterproductive. However, laddering is necessary for nucleosome positioning and footprinting analyses, which typically require deeper sequencing.
The Active Motif ATAC-seq kit was developed specifically for profiling open chromatin; therefore, the protocol may need to be optimized if advanced analyses are the goal.
In general, a library showing one to three peaks between 180–600 bp, with fragment sizes trailing off beyond 800 bp, would be considered suitable for sequencing. Ultimately, sequence analysis will provide the most reliable measure of success, while library fragmentation patterns offer only an initial indication of assay quality.
A peak around 40–50 bp is most likely due to primer dimers. When starting with low cell numbers, there may be insufficient DNA for primers to bind properly, increasing the likelihood of primer self-annealing. Additionally, Tn5 tagmentation of low-input DNA can result in short or few amplifiable fragments, further raising the chance of primer dimer formation.
The left-side SPRI bead selection is designed to remove these dimers; however, they may still be present in the final library. If the dimers make up less than 5% of the total library, a second left-side selection may not be necessary. However, if the proportion of primer dimers is relatively high, an additional left-side selection is recommended.
If the overall library concentration is already low, you may need to either repeat the experiment or attempt the cleanup with the understanding that you might not have enough material left for sequencing.

Figure 1. Common ATAC-seq library DNA fragmentation patterns and explanation of peaks.
Under-Tagmentation
If the loaded Tn5 does not have adequate access to the open chromatin in the cells, or if the ratio of Tn5 to DNA is too low, it will not be able to cut the DNA at a high enough frequency to create fragments in the ideal range. Referred to as under-tagmentation, the majority of the fragments will be greater than 800 bp (see Figure 2). The downside of all these large fragments is that they cluster inefficiently on the flow cell, creating low cluster density and lower output. Because they do not sequence as efficiently as smaller fragments, a higher number of sequencing reads will be required to get the same coverage, at higher cost.
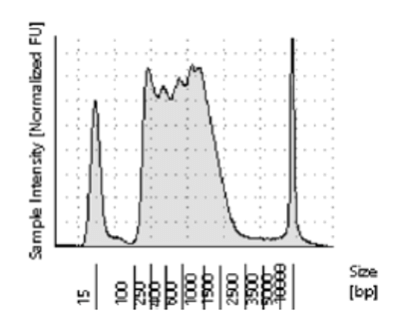
Figure 2. Under-tagmented ATAC-Seq library with most of the fragments between 800 and 2500 bp.
There can be several causes for undertagmentation. But most commonly it’s due to a poor nuclei prep, which makes it difficult for the Tn5 to gain access to the chromatin. We see it more often in tissue samples than in cultured cells, likely because it’s more difficult to get good separation and suspension of nuclei from tissue. If not careful, tissue will not be adequately separated into a single cell suspension, making for poor lysis of cells. If under-tagmentation is being observed in libraries try some of the following tips:
- Ensure complete resuspension in lysis buffer (homogenization for tissue).
- Increase incubation time in lysis buffer on ice.
- Increase the amount of transposase in the tagmentation reaction or decrease the number of cells. A titration of either is recommended.
- Add additional PBS washes prior to lysis, in case something in the sample is inhibiting lysis.
Another cause of large DNA fragments is poor sample quality. Many dead cells can result in an excess of unprotected, apoptotically-derived DNA that can saturate the activity of the Tn5, leaving little activity for chromatin bound DNA. To prevent this use fresh cells or cryopreserve cells in 50% FBS/40% growth media/10% DMSO. If using tissue, excise, and flash-freeze in liquid nitrogen. Store at -80 °C. Work quickly with tissue and do not allow it to thaw before transferring it to a petri dish on ice for mincing.
Additionally, the ratio of transposase to cell number is an important variable to consider. The more Tn5 enzyme that is available, the more tagmentation will occur, resulting in shorter DNA fragments. Our ATAC-seq kit protocol has been optimized for 50k-100k cells. However, if libraries appear undertagmented and all other variables have been considered, it will be beneficial to perform a titration trial. A possible setup might be to create reactions with the following cell numbers: 25k, 50k, 100k, 200k. Keep the amount of Tn5 the same in each reaction and check the fragmentation pattern. Choose the condition that results in a pattern of 1-3 peaks between 200-600bp with the fragment size trailing off as they approach 1000bp. Alternatively, if cell number is limited, you can also titrate the amount of transposase in the tagmentation reaction. Keeping the number of cells the same in each reaction and keeping the volume of the tagmentation reaction constant by increasing/decreasing the amount of ddH20. FACS sorted cells will undergo damage from the sorting process. Use good sorting techniques to minimize damage. Start with as many cells as possible. Note that sorting for a rare population of cells <10% will do more damage to the target cells than a higher one like 70%.
Good general lab technique will help with consistency. If only doing one or two preps at a time, pipetting volumes for some reagents can be just a half microliter or two, which is difficult to pipette accurately. Create a tagmentation master mix when possible and do several preps at once, for consistency between samples.
Salvaging the Library Prep
When there is undertagmentation, the prep does not necessarily need repeating. By doing a right-sided cleanup of the DNA with SPRI beads, large fragments can be removed. Our standard ATAC-Seq protocol contains a left-sided cleanup of the library, removing small fragments like primers under about 150 bp. Because there is always some sample loss during SPRI bead clean-up, a right-sided cleanup step to remove large fragments is not part of our standard protocol. It’s typically not necessary. However, if it’s observed that most of the library fragments are over 800 bp, a right-sided cleanup to remove the large fragments is probably worth the small sample loss, in order to get more efficient sequencing. In Figure 3 below, an example is shown of an ATAC-Seq library before and after a right-sided clean-up using 0.6x ratio of AMPure XP beads to DNA volume. While there is some overall loss of the DNA, there is still plenty for sequencing. See below for Library Yields: ATAC-Seq.
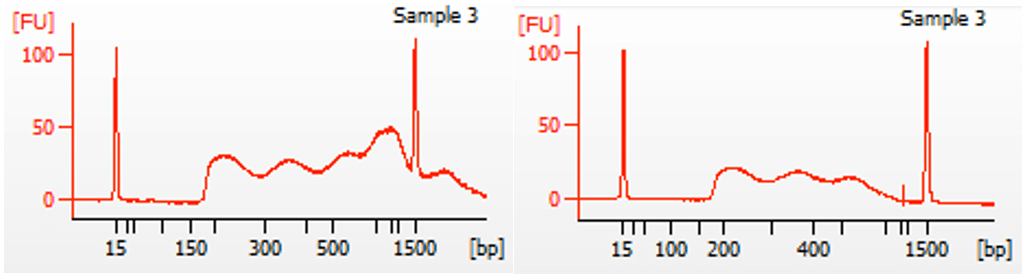
Figure 3. Right-sided clean-up of DNA using 0.6x ratio of AMPure XP beads to DNA volume.
Library Yields: ATAC-Seq
Another common question we get is how much library to expect per ATAC-Seq prep. In the most ideal circumstances, starting from 50,000-100,000 fresh cells, and a perfectly executed protocol, there can be as much as 400-600 ng. In the Active Motif Kit this is eluted in 20 µl elution buffer for a concentration of 20-30 ng/µl. FACs sorted cells will give lower yields for the same number of cells, due to cell damage. Also, sometimes there are not 50,000 cells to work with, which means less library. Inexperienced users may get less DNA due to losses from the various steps, especially the SPRI bead clean-up. Limit loss of sample by gently adding ethanol to the bottom of the tube and allowing it to gently rise in the tube without disturbing the magnetic pellet. Do not over dry the magnetic beads. If the beads crack, this can result in sample loss. During column purification of DNA be sure to pipette the elution buffer to the center of the column.
Fortunately, a small amount of DNA is required for sequencing. Active Motif Services sometimes has samples that are as low as 20 ng (1 ng/µl) which are sequenced with quality data. It’s best not to get too hung up on the yields. If there is enough DNA for pooling libraries on the sequencer, and the fragments look good, then it’s probably worthwhile moving forward with sequencing.
ATAC Quick Tips:
- Aim for 1-3 peaks between 200-600bp. Fragments should be trailing off after 800bp.
- A final library concentration of 20-30ng/ul is achievable; 1ng/ul or greater is acceptable.
- Excess primers dimers (>5%) should be removed using a second SPRI bead clean-up.
- Large fragments (>600bp) in undertagmented libraries can be removed using a right-side SPRI bead selection if sufficient library is present in the 200-600bp range.
- After cell quality, the Tn5:cell number ratio has the largest impact on the fragmentation pattern. This ratio may need to be optimized for your sample type.
- Increasing PCR cycle number will not improve data quality as much as increasing cell count, cell quality and proper tn5:cell ratio.

Library QC: CUT&Tag / CUT&Tag R-Loop
In the CUT&Tag protocol, there is no cell lysis step for isolation of nuclei prior to tagmentation. Intact cells are first bound to magnetic Concanavalin A beads before a primary antibody is bound to either a histone mark or transcription factor target on the DNA. A secondary antibody is then bound to increase the signal and an adapter-loaded pA-Tn5 used to target the secondary antibody where it cuts the DNA at that location. Unlike ATAC-Seq there will not be as many small fragments, as the pA-Tn5 should only be cutting where the antibody is bound. A mononucleosome and oligonucleosome ladder is typically observed in the library prep trace due to the peak-to-peak distance between neighboring nucleosomes. With the length of the adapters on the DNA of 135 bp and a peak-to-peak nucleosome distance of 150-200 bp, the result is a nucleosome ladder 150-200 roughly the same distance apart. Typically, a peak around 350bp is associated with mononucleosomes and 550 bp dinucleosomes. A pronounced mononuclsome peak is often considered ideal; however, variation in sample types and conditions will result in variation of patterns. It is more important that you see a peak in the 200-600bp range. See an example in Figure 4 below which shows a library trace for H3K27me3 and K562 cells.
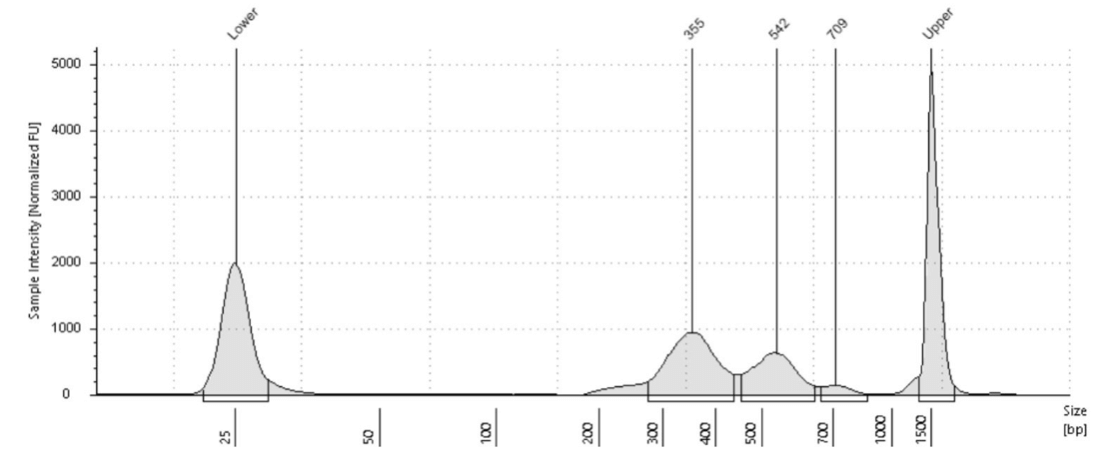
Figure 4. Example CUT&Tag library from 100K or 100,000 K562 cells and H3K27me3.
Small variations in the ratio of the antibody or pA-Tn5 and the number of cells can shift the height of the peaks. However, as demonstrated in the paper by Kay-Okur et al, (2019), these variations are not critical as they still can result in consistent sequencing data. Figure 5 below, shows how changes in the amount of pA-Tn5 added to the tagmentation reaction can cause variability in library peaks, with lower concentrations shifting the larger peaks to higher fragment sizes. Yet, these all resulted in identical normalized sequencing tracks.
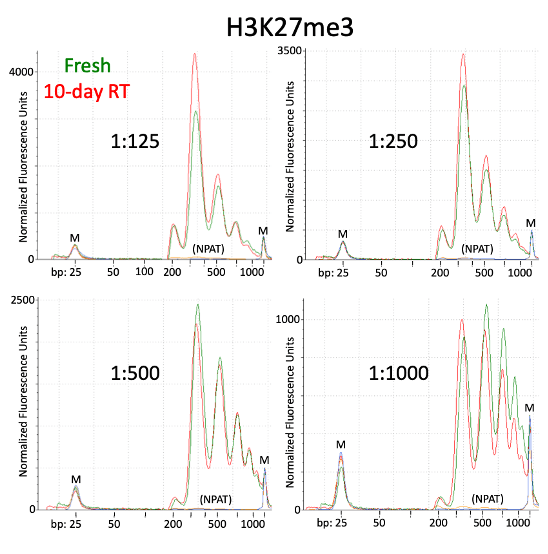
Figure 5. Figure adapted from Kay-Okur et al, (2019) shows fragment analysis from CUT&Tag was done for libraries for the abundant histone modification, H3K27me3. Varying dilutions of pA-Tn5 were used during tagmentation. After a single 1.1X AMPure-bead clean-up, DNA was eluted with 25 μl 10 mM Tris-HCl pH 8, and Tapestation D-1000 analysis was performed on a 2 μl sample. Markers (M): lower = 25 bp and upper = 1500 bp.
Library Yields: CUT&Tag
If a sparse antibody target like a transcription factor is used or a small number of cells (<20,000), there may appear to be little to no library at all in the electropherogram. This makes it difficult to determine whether to move forward with sequencing. In these cases, it’s useful to run a positive control alongside these samples to ensure the protocol is working. As Steven Henikoff has pointed out, fragments from H3K27me3 are easily detected, as the genome coverage in most cell types is ~3% , which equates to ~100 million base pairs over a human genome. Genome coverage for a transcription factor with 10,000 bound sites is ~1 million base pairs, which might not be detectable by library fragment analysis. In Active Motif Services, if a positive control like H3K27me3 shows a good signal, then even if there is no visible library with another antibody, we have found it is worthwhile to move forward with library quantitation. If there is at least 1 ng/ μl (~4 nM for average of 360 bp) then it is worthwhile moving forward with sequencing. Figure 6 below shows an example of a very low quantity library from K562 cells and an H3K27ac antibody. This library resulted in enough DNA for successful sequencing.
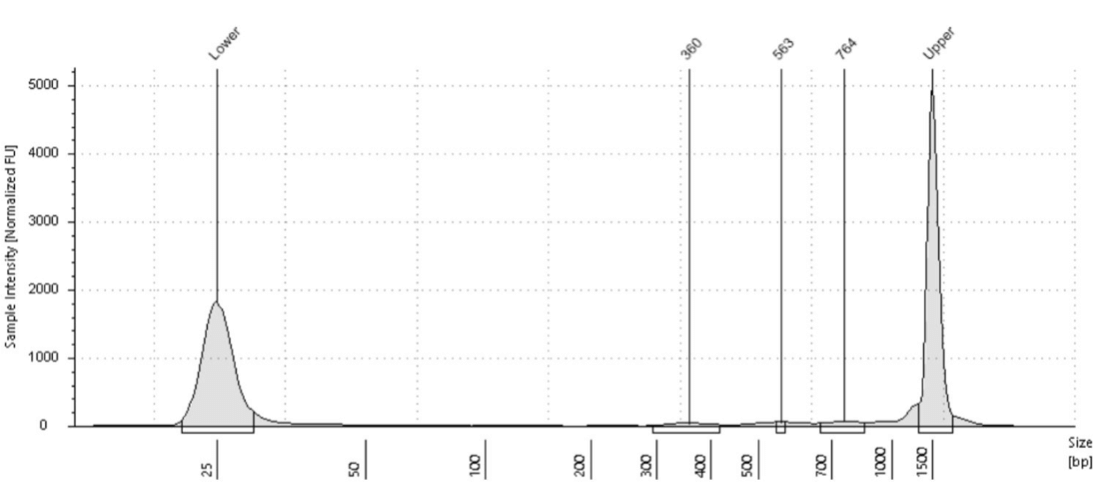
Figure 6. Example CUT&Tag library from 100 thousand K562 cells using an H3K27ac antibody. Despite the low yields, there was enough DNA for successful sequencing and quality data.
Library Quantification - General Guidelines
When pooling libraries for sequencing, it is important that library concentrations be accurate so that cluster densities are optimized on the flow cell and that there is a uniform distribution of reads across all libraries. Optimal concentrations are determined by the sequencer and the sequencing reagent kit used. When combined, each library will be diluted by the others. And so, the minimum library concentration required needs to be higher than the final library concentration that goes into the sequencer.
To quantify the library for sequencing on an Illumina instrument, we recommend using a qPCR-based assay like a KAPA Library Quantification Kit. Estimates of yields can be determined from a TapeStation or Bioanalyzer, but it will not be as accurate. KAPA Library Quantification works by selectively amplifying library fragments which contain the P5 and P7 adapter sequences that bind to the Illumina flow cell. By amplifying only those fragments, theoretically only sequencable DNA will be quantified. It’s a more accurate technique for quantification than using a spectrophotometry-based method like a NanoDrop or an electrophoresis-based system like the Bioanalyzer, both which will quantify all DNA whether it contains adapters or not.
With a qPCR-based assay, the quantification cycle (Cq) for each amplified library is compared to the Cq values from a set of DNA standards. The library concentration can then be determined from the standard curve. The molar concentration depends on the size of the DNA fragments. This is straight-forward for many library preps, where there is a single narrow and uniform peak, but ATAC-Seq and CUT&Tag libraries contain a large spread in fragment density, often with multiple peaks. This can make it a little trickier to determine the working concentration. You’ll need to look at where most of the fragments lie or the highest peak in the sample and use that. Support for calculating dsDNA library concentration from molar concentration and pooling libraries can be found on the Illumina website.
Troubleshooting
If a positive control antibody like H3K27me3 produces a library but other targets fail, it may be the result of using an antibody that was not validated for CUT&Tag. If targeting a transcription factor, then CUT&Run or ChIP-seq may be more appropriate assays.
If using validated antibodies and little to no library is produced, this typically indicates a sample quality or sample loss issue. It is important to start with viable cells confirmed by a nuclear stain, e.g. Trypan blue/AOPI. 70% cell viability or better is recommended. If using isolated nuclei, the nuclei must be of high quality. Little to no blebbing or fragmentation should be observed. If starting with tissue, confirm that debris is not misrepresenting the number of counted cells/nuclei; AOPI is typically superior for this purpose. For more information check out our cell counting tech note.
Before beginning the assay confirm that the concanavalin beads (con A) are not aggregated. Con A beads are very sensitive to freezing temperatures. If they are found to be aggregated, then do not use them and contact Active Motif Technical Services. To check aggregation, dilute 5–10 µl of Con A beads in an equal volume of PBS and inspect under a microscope using a hemocytometer or glass slide with cover slip. Uniformly dispersed, small, light brown particles indicate usable beads. Large, dark brown clumps suggest aggregation and necessitate replacement.
If con A bead aggregation is not the issue, the next variable to check is successful cell binding to the con A beads. This can be confirmed after the step where the cells and beads are mixed and placed on the magnetic stand (refer to your specific protocol). Before discarding the supernatant, visualize 10ul of the buffer using a hemacytometer; there should be few to no cells in the supernatant, as they should be bound to the con A beads. Expect to see less than 5% of unbound cells from the total number of cells used in each reaction, for functional beads. If cells are not attached to the beads, then the issue could be con A beads quality or a harsh enzyme like trypsin was used to detach cultured cells or for tissue dissociation. It is recommended to use a reagent such as TrypLE or Accutase that do not interfere with the glycoproteins on the cell membrane that are necessary for successful con A bead binding.
Another important QC step is confirming successful cell permeabilization using Trypan blue after adding the digitonin-containing antibody buffer. Check that digitonin was added to the buffer as it is a critical component. Next, using a hemacytometer and Trypan blue, confirm that all cells are stained blue. This is a less common issue but important to verify, especially when working with primary cells like lymphocytes, which are notoriously difficult to permeabilize. If the cells are not permeabilized, then the digitonin was not added, or the concentration may need to be increased.
CUT&Tag R-Loop
Active Motif’s CUT&Tag-IT® R-loop Assay Kit utilizes an optimized CUT&Tag protocol for R-loop profiling. RNase A is used to deplete the sample of R-loops and serves as a negative control. We typically observe a 5- to 35-fold decrease in library yield in the RNase A-treated control.
Although RNase H is often cited in the literature as the optimal enzyme for degrading R-loops, we found that RNase H does not efficiently cleave RNA:DNA hybrids in situ. In contrast, RNase A was found to be more effective for this application.
Despite some differences in the protocol, the general library characteristics and troubleshooting steps remain applicable. Libraries from this assay typically show 1–3 peaks in the 200–600 bp range, and the overall library yield is often lower than that obtained with a highly abundant histone mark.
It may be worthwhile to sequence even very low-yield libraries as long as the RNase A control yields are 5–35 times lower than those of the untreated sample. If an amplified library is not observed despite following the recommended troubleshooting steps, consider using a positive control antibody, such as H3K27me3 (Cat# 39156). This will help determine whether the assay is being performed correctly.
Note that some biological samples may contain very low levels of R-loops, making detection difficult. In such cases, it is advisable to test a positive control cell line known to contain abundant R-loops, such as HeLa, HCT116, or K562, to determine whether the issue lies with the sample type.
CUT&Tag-IT® R-loop Library Examples
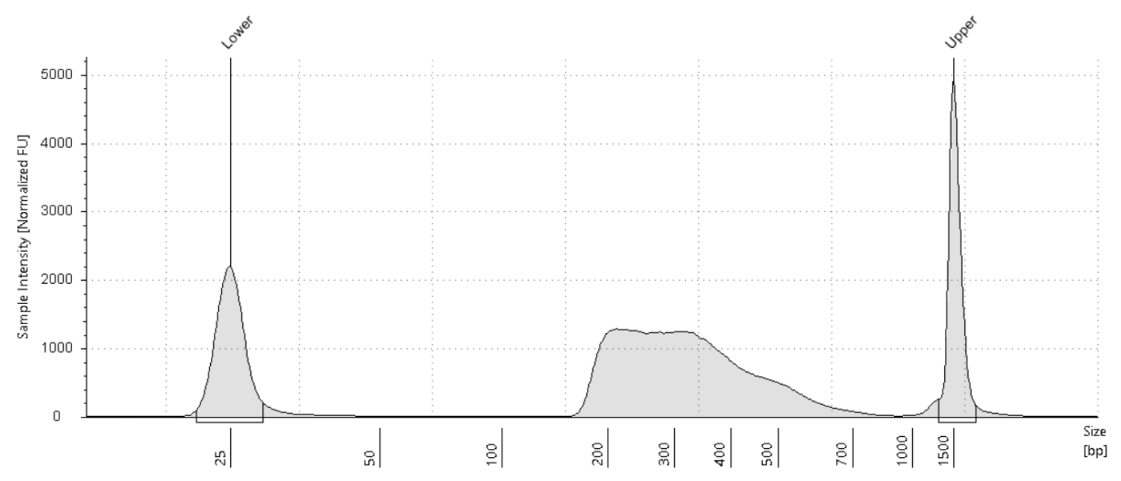
Figure 7. 500,000 fresh K562 cells
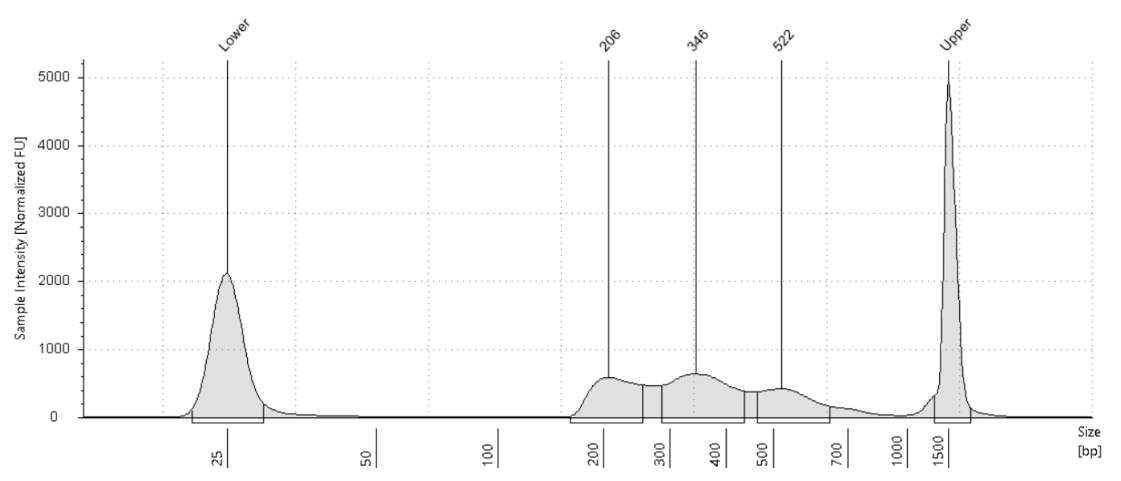
Figure 8. 500,000 fresh Jurkat cells
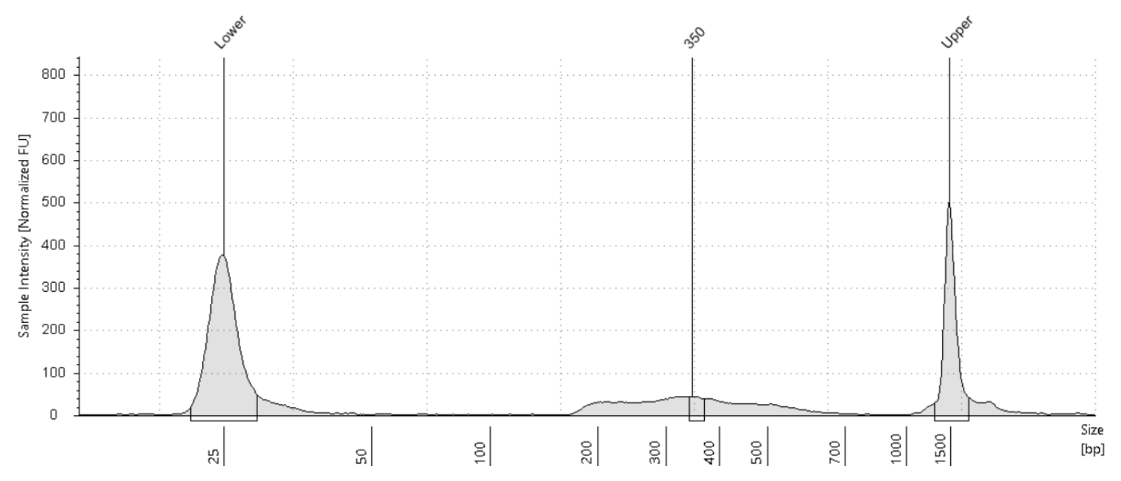
Figure 9. RNase A treated negative control
CUT&Tag Quick Tips:
- A library profile with a single peak between 200–600 bp and a total concentration of >1 ng/µl is typically suitable for sequencing. While a strong mononucleosomal peak around ~350 bp is often considered ideal, it is not required.
- Usable data can still be obtained from smaller libraries, provided that the positive control yields are adequate and there is sufficient material for sequencing.
- If no library is observed, consider the following variables:
- Cell number
- Cell quality/viability
- Con A bead condition
- Con A bead binding efficiency
- Cell permeabilization efficiency

Summary
Expect variability in the appearance of library fragments in ATAC-Seq and CUT&Tag. Even when using kits which contain consistent reagents each time, small variations in cell numbers, cell lysis, or the frequency of a particular histone mark, can result in differences in cutting frequency of the Tn5 or pATn5. However, even with this variability in cutting frequency and the resulting differences in library fragment appearance, the quality of sequencing data can still be robust between these samples, as data peaks still depend mainly on the accessibility of Tn5 to open chromatin or pA-Tn5 to an antibody. The appearance of the library should be seen as a qualitative indicator as to whether it is worthwhile to move forward with sequencing.
Quantification of libraries should be done using a Qubit or qPCR-based assay for accuracy and for most efficient and balanced sequencing on the flow cell. Hopefully, the guidelines above will be helpful when deciding how to proceed with libraries. Please feel free to contact Active Motif technical support with any questions at [email protected].
References:
https://www.sciencedirect.com/science/article/pii/S2666166720300666
Holly Brunton, Ian M. Garner, Ulla-Maja Bailey, Rosie Upstill-Goddard, Peter J. Bailey, Using Chromatin Accessibility to Delineate Therapeutic Subtypes in Pancreatic Cancer Paient-Derived Cell Lines, STAR Protocols, Volume 1, Issue 2, 2020,100079, ISSN 2666-1667 https://doi.org/10.1016/j.xpro.2020.100079.
https://bmcgenomics.biomedcentral.com/articles/10.1186/s12864-018-4559-3
Ou, J., Liu, H., Yu, J. et al. ATACseqQC: a Bioconductor package for post-alignment quality assessment of ATAC-Seq data. BMC Genomics 19, 169 (2018).
https://doi.org/10.1186/s12864-018-4559-3.
https://www.nature.com/articles/s41467-019-09982-5
Kaya-Okur, H.S., Wu, S.J., Codomo, C.A. et al. CUT&Tag for efficient epigenomic profiling of small samples and single cells. Nat Commun 10, 1930 (2019).
https://doi.org/10.1038/s41467-019-09982-5 .
https://www.protocols.io/view/bench-top-cut-amp-tag-bcuhiwt6?step=66
A special thank you to scientists Jesse Lopez and Casidee McDonough in Active Motif Services for their technical expertise on ATAC-Seq and CUT&Tag.
About the authors
Michelle Tetreault Carlson, Ph.D.
Michelle’s interest in science was first spurred by the starry skies above her rural farm in upstate New York State, leading her to pursue a B.S. in physics. She was originally interested in astrophysics when entering the University of California, San Diego, but transitioned towards the more practical pursuit of biology earning her Ph.D. in Biophysics, studying photosynthetic proteins. Michelle’s postdoctoral research on retinal ion channels, took her further towards biology, ultimately leading to a career in the biotech industry. She enjoys chatting with scientists about their projects and interacts with them both as a Technical Support Scientist and Product Manager for Active Motif’s DNA Methylation products.
Michelle is a mother of 4 kids and 2 cats, and her hobbies include puzzles (the sign of a patient and logical mind), cooking, and pondering the human condition.
Marc Paradise
Marc grew up in New York and served as a U.S. Navy rescue swimmer and aircrewman aboard SH-60 helicopters before beginning his academic career. He earned his B.S. in biochemistry and cell biology from the University of California, San Diego. Marc went on to manage a research lab at the UCSD Moore’s Cancer Center, where he focused on cancer immunology—particularly macrophage phenotypes in the tumor microenvironment— he also established and ran a 10x Genomics single-cell sequencing core for the center. He is currently a Technical Support Scientist at Active Motif, helping researchers advance their work in epigenetics. Outside of the lab, Marc enjoys golf, as well as strength and conditioning sports.
Related Articles
Comprehensive Guide to Understanding and Using CUT&Tag Assays
November 24, 2020
CUT&Tag shows a lot of promise and has the potential to alleviate some ChIP limitations, but it also has its own set of limitations that must be considered. This article covers what CUT&Tag is and describes the advantages and drawbacks of this method.
Read More
Complete Guide to Understanding and Using ATAC‑Seq
February 9, 2021
The ATAC-Seq method was just published in 2013 and it has already become one of the most common and powerful ways to study chromatin states on a genome-wide level. This article covers what ATAC-Seq is and how to use it in your research.
Read More
<< Back to MOTIFvations Blog Home Page


