CUT&Tag-IT Spike-In Control Overview
Related Products:
- CUT&Tag-IT Assay Kit – Cells: Perform CUT&Tag on cell samples
- CUT&Tag-Validated Antibodies: For best results with both tissue and cell samples
- pA-Tn5 Transposase: Recombinant transposase enzymes
- Nextera™-Compatible Multiplex Primers (96 plex): Multiplex more than 16 samples
Cleavage Under Targets and Tagmentation (CUT&Tag) has emerged as a powerful method for profiling the localization of histone modifications of interest genome-wide. However, the identification of differences between data sets can be challenging when global modification changes occur, such as in the case of studying the effects of chromatin modifying enzyme inhibitors. Additionally, inaccurate quantification of starting material or technical variation during processing, results in variation across sample data. Currently available bioinformatic-based normalization methods are not applicable in these instances, and the only reliable way to overcome bias and variation is to add a known standard (spike-in) into all samples. Active Motif offers spike-in reagents for ChIP-Seq and has now introduced a similar approach for CUT&Tag.
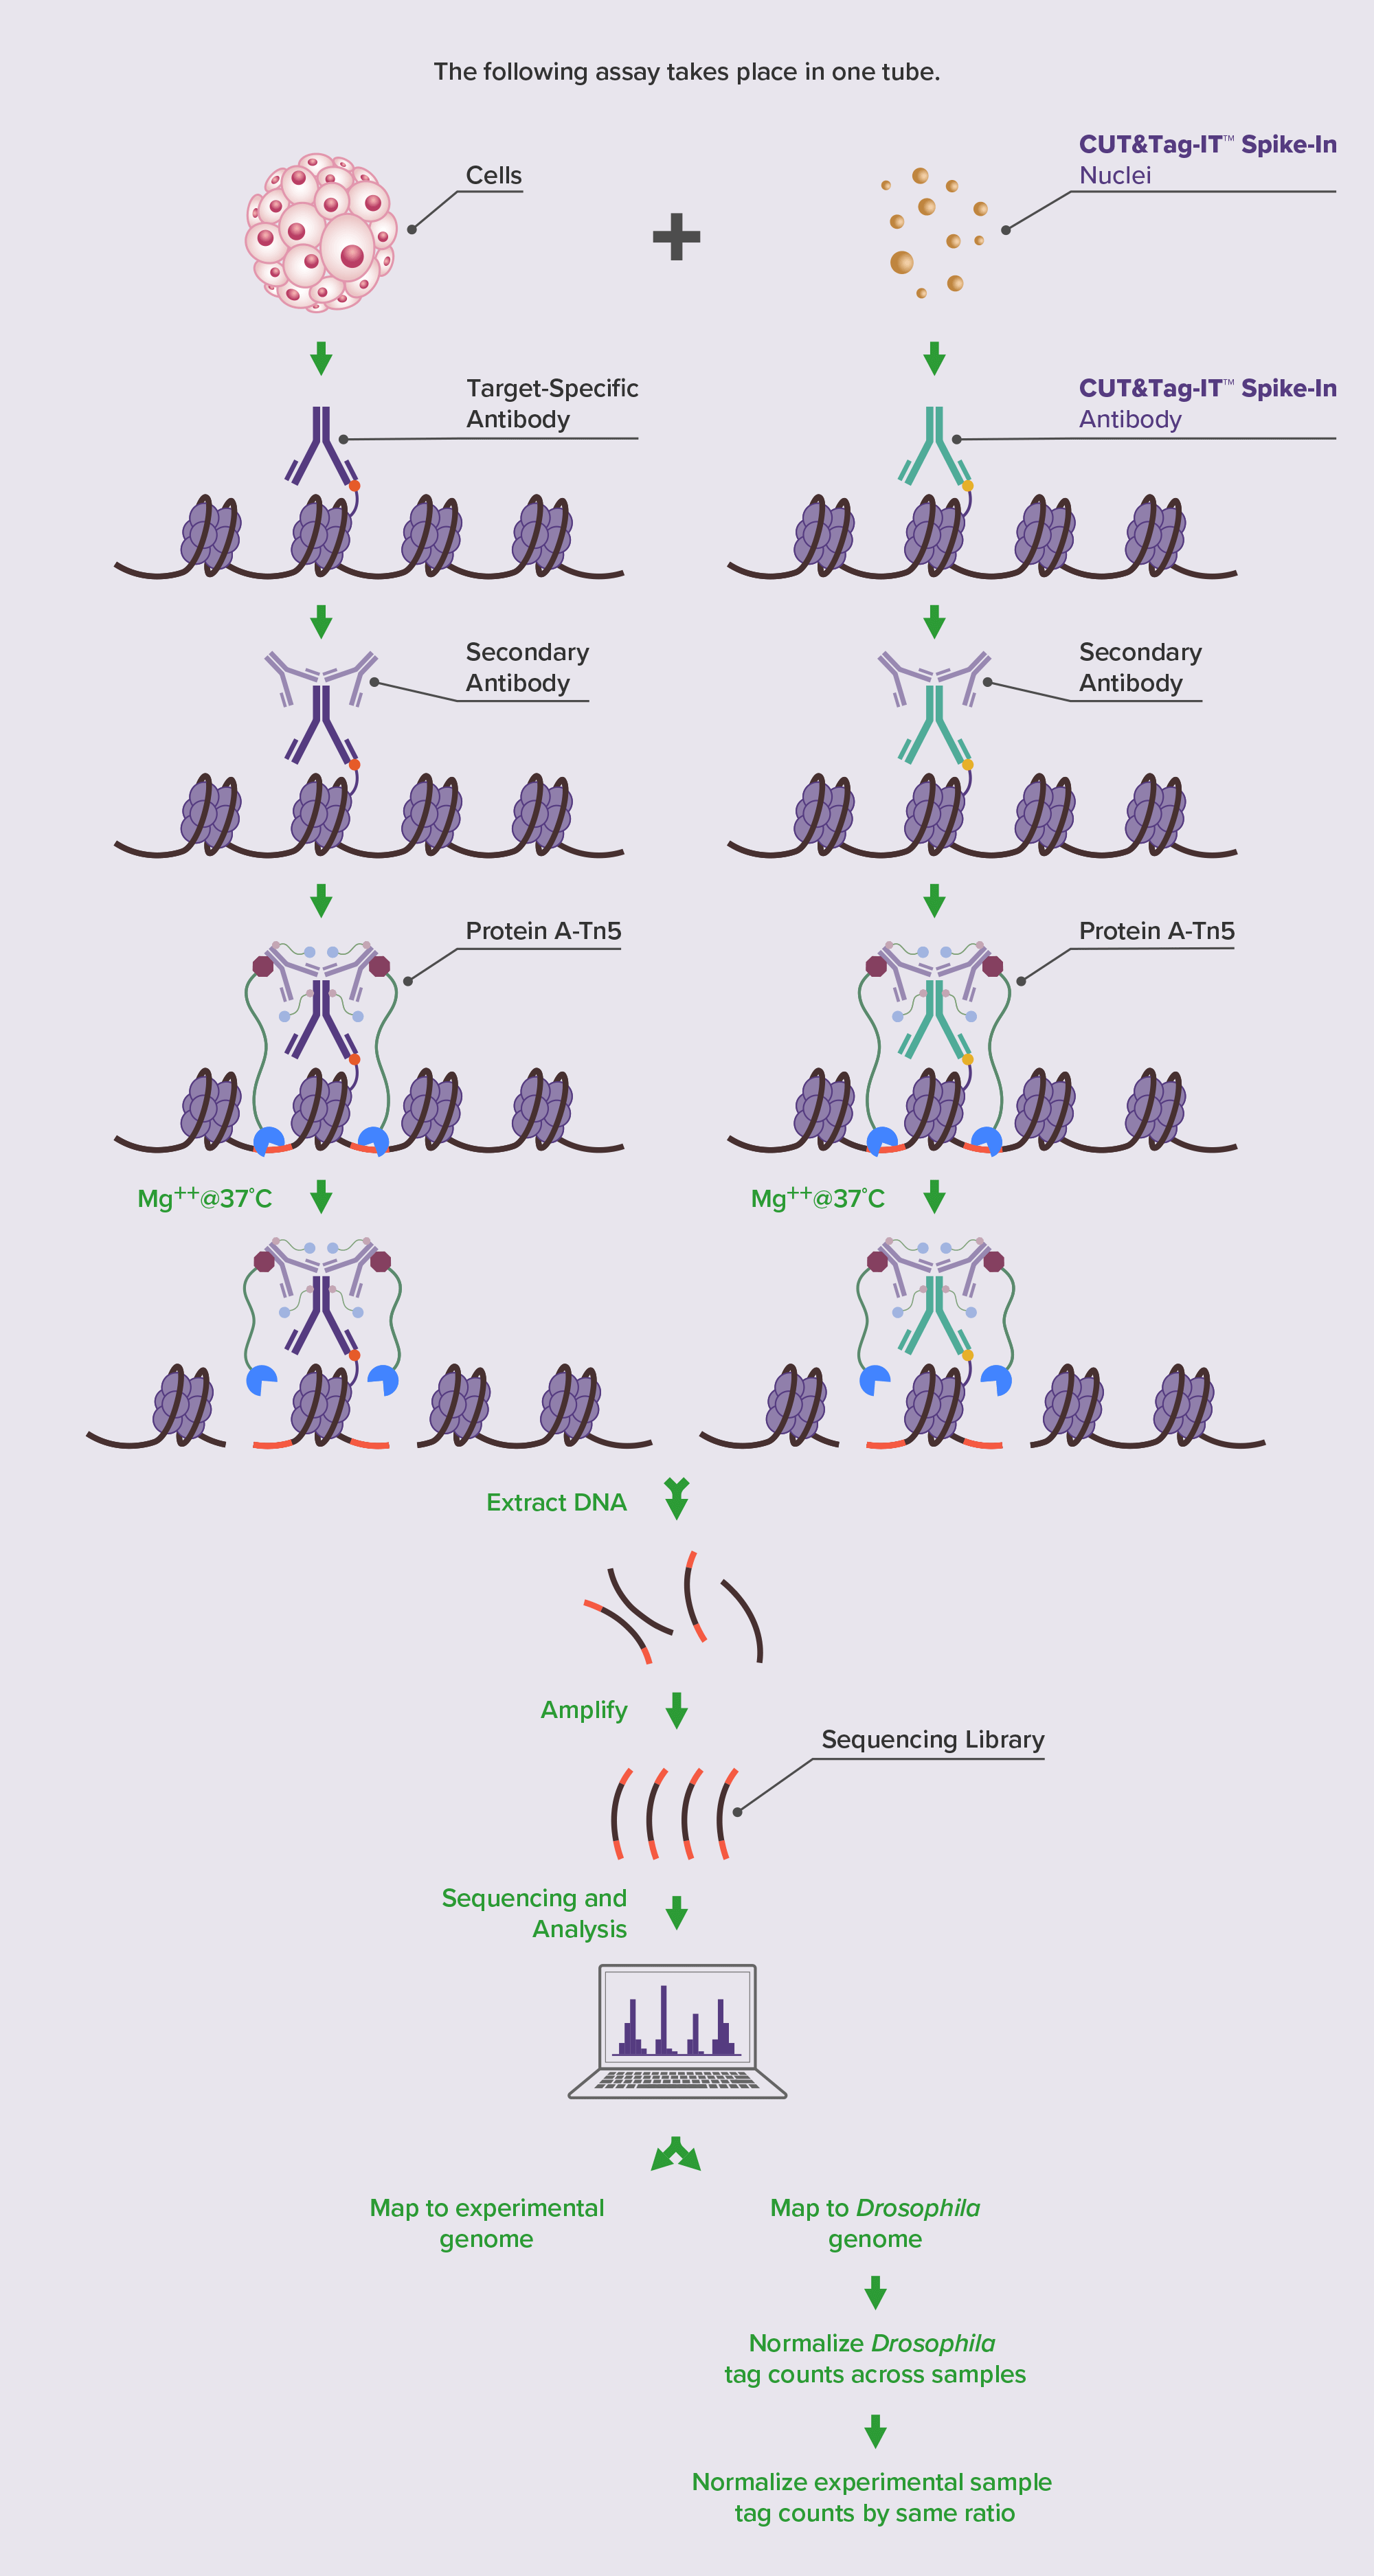
Active Motif’s strategy for CUT&Tag normalization is to spike cryopreserved Drosophila cell nuclei into samples prior to CUT&Tag. Then, during the primary antibody incubation step, a Drosophila H2Av antibody is added in addition to the antibody targeting the histone mark of interest. This Drosophila H2Av antibody does not cross react to other species and provides a mechanism to reliably tag Drosophila chromatin in a consistent way across all samples. A normalization factor is then created based on the Drosophila signal and applied to the test genome. This CUT&Tag-IT® Spike-In Control strategy enables normalization of CUT&Tag data independent of the experimental antibody and without bias.
Learn more about CUT&Tag and how it worksCUT&Tag-IT Spike-In Control Highlights:
- Compare CUT&Tag datasets between samples
- Simply add Spike-In Nuclei to samples and perform CUT&Tag with the Spike-In Antibody together with the experimental target antibody
- Obtain normalization factor and reveal true differences between samples
How the CUT&Tag-IT Spike-In Control Works
(Click image to enlarge)
CUT&Tag-IT Spike-In Control Contents
- CUT&Tag-IT® Spike-In Antibody, store at -20°C (only included in Cat No. 53168)
- CUT&Tag-IT® Spike-In Antibody, Mouse, store at -20°C (only included in Cat No. 53173)
- CUT&Tag-IT® Spike-In Nuclei, store at -80°C
CUT&Tag-IT Spike-In Control Data
How CUT&Tag-IT Spike-In Control Improves CUT&Tag Analysis
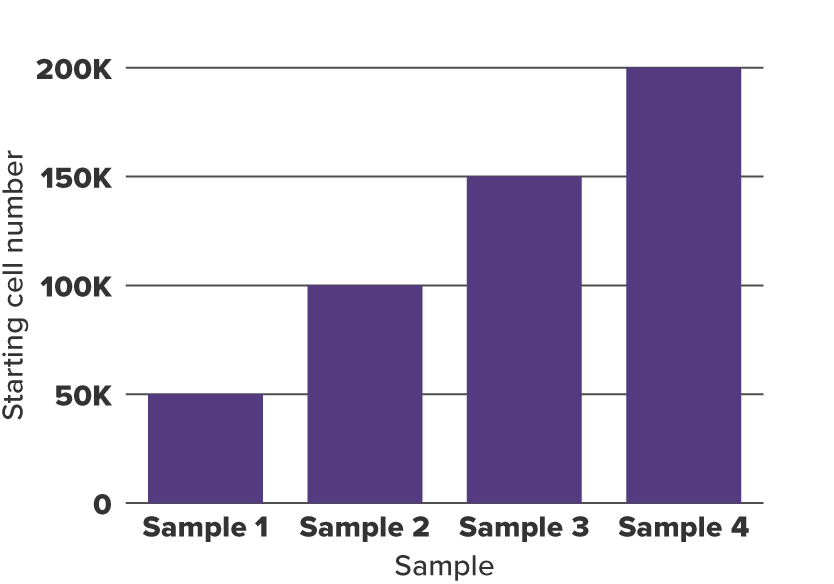
To demonstrate the utility of this approach, differences in global levels of histone modifications were mimicked by setting up CUT&Tag reactions with different amounts of starting cell numbers (Figure 1). Various numbers of cryopreserved human K562 cells (50,000, 100,000, 150,000, and 200,000) were combined with a constant amount (20,000) of cryopreserved Drosophila nuclei for each experiment. Two histone marks, H3K27me3 and H3K4me3, were evaluated in the CUT&Tag spike-in assay, with biological duplicates included in each experiment. Libraries were quantified and sequenced to a depth of 25 million reads per sample. However, sequencing to equal read depth for each sample masks the differences in starting amounts for each sample (Figure 2). Therefore spike-in normalization is required to reveal the differences in starting material. For normalization, the sample with the lowest number of Drosophila reads (Figure 3) was used to generate normalization factors across samples, which were then applied to down-sample the human read counts for each sample accordingly (Figure 4). After obtaining normalized human read counts, a standard CUT&Tag pipeline was used for peak calling generation of bigwigs.
 (Click image to enlarge)
Figure 1. K562 Starting Cell Numbers for CUT&Tag
50,000, 100,000, 150,000, and 200,000 K562 cells were used in CUT&Tag.
 (Click image to enlarge)
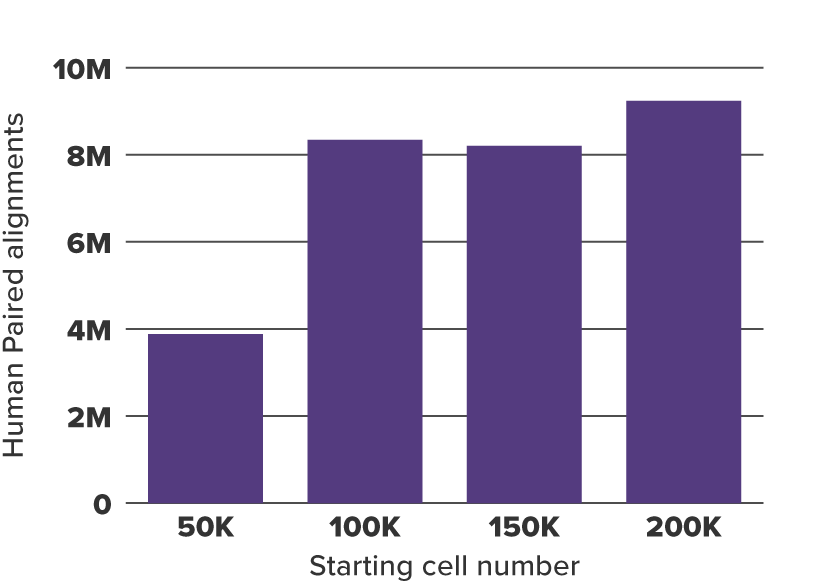
Figure 2. K562 Paired Alignments
Duplicates and mitochondrial reads were removed from paired alignments from duplicate K562 samples. Paired alignments for each condition are shown. The number of alignments is not reflective of the number of cells added to the experiment, thus normalization is needed.
 (Click image to enlarge)
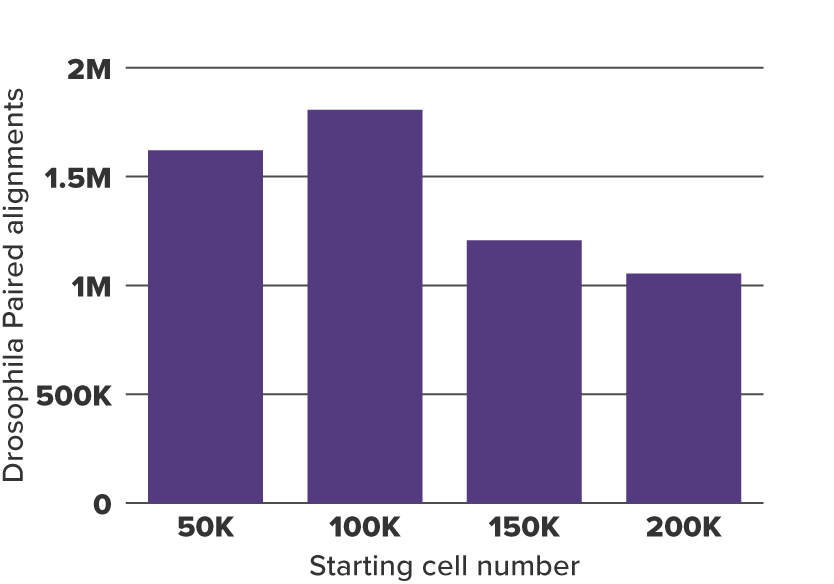
Figure 3. Drosophila Paired Alignments to Obtain Normalization Factor
20,000 CUT&Tag-IT Spike-In Nuclei were added to 50,000, 100,000, 150,000, and 200,000 K562 samples and assayed in CUT&Tag. The resulting Drosophila alignments for 50,000, 100,000, 150,000, and 200,000 K562 samples are shown. In general, the more K562 cells in the experiment, the less Drosophila alignments resulted because more reads are mapped to K562 cells. To generate the normalization factors the aligned drosophila tag value from the sample with the lowest drosophila tag count was divided by the drosophila tag count value from all other samples.
 (Click image to enlarge)
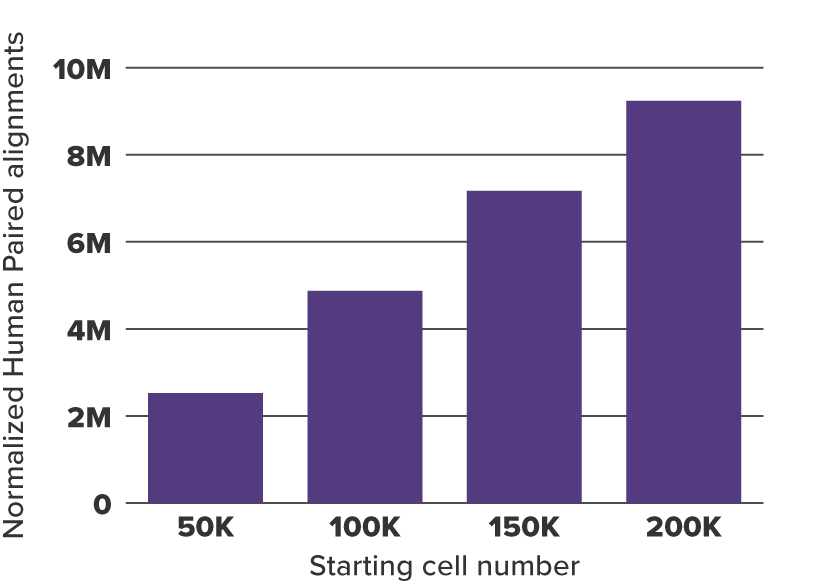
Figure 4. K562 Paired Alignments After Normalization to Drosophila Paired Alignments
K562 paired alignments were normalized to the Drosophila alignment number from 200,000 K562 cells shown in Figure 3. Now the expected ratios based on amount of starting cells has been restored.
 (Click image to enlarge)
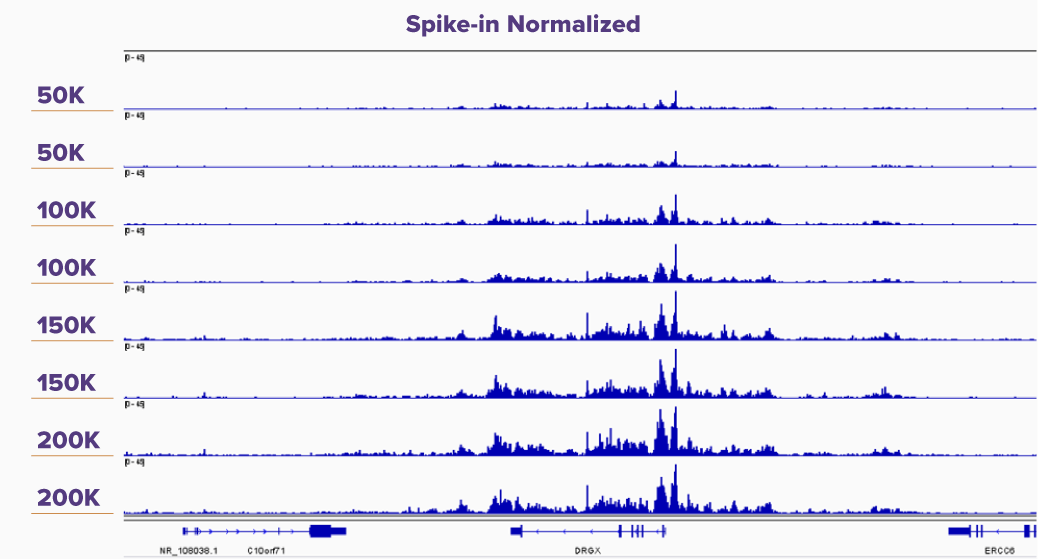 (Click image to enlarge)
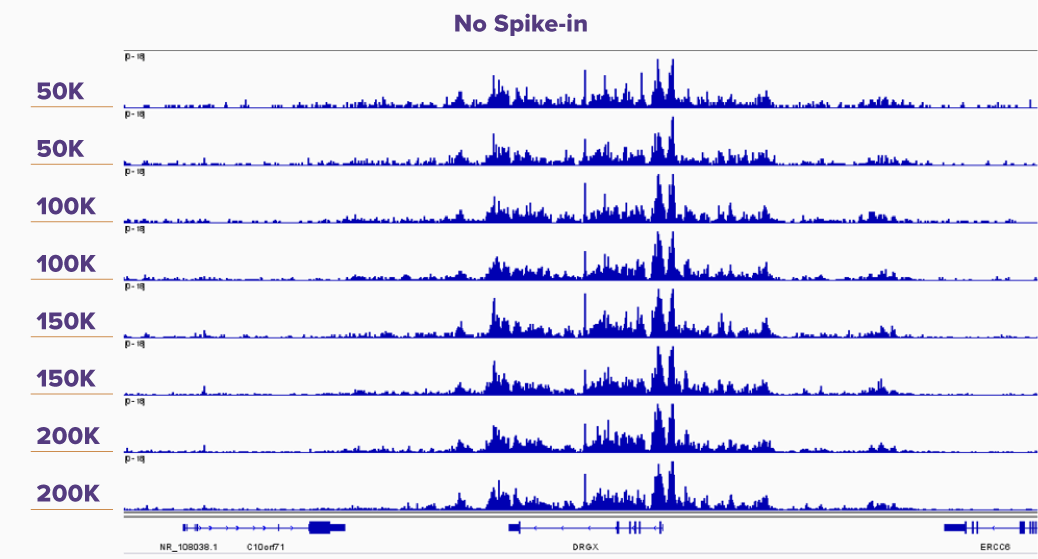
Figure 5. K562 CUT&Tag-IT Assay Results With and Without CUT&Tag-IT Spike-In Control Normalization
IGV browswer tracks are shown for duplicate reactions of 50,000, 100,000, 150,000, and 200,000 K562 cells assayed in CUT&Tag for H3K27me3 without spike-in and with CUT&Tag-IT Spike-In Control normalization. In the Spike-in Normalized panel it is clear that the peak height correlates with increasing cell number, whereas in the No Spike-in control peak height differences are not noticeable from 50,000 to 200,000 cells.
(Click image to enlarge)
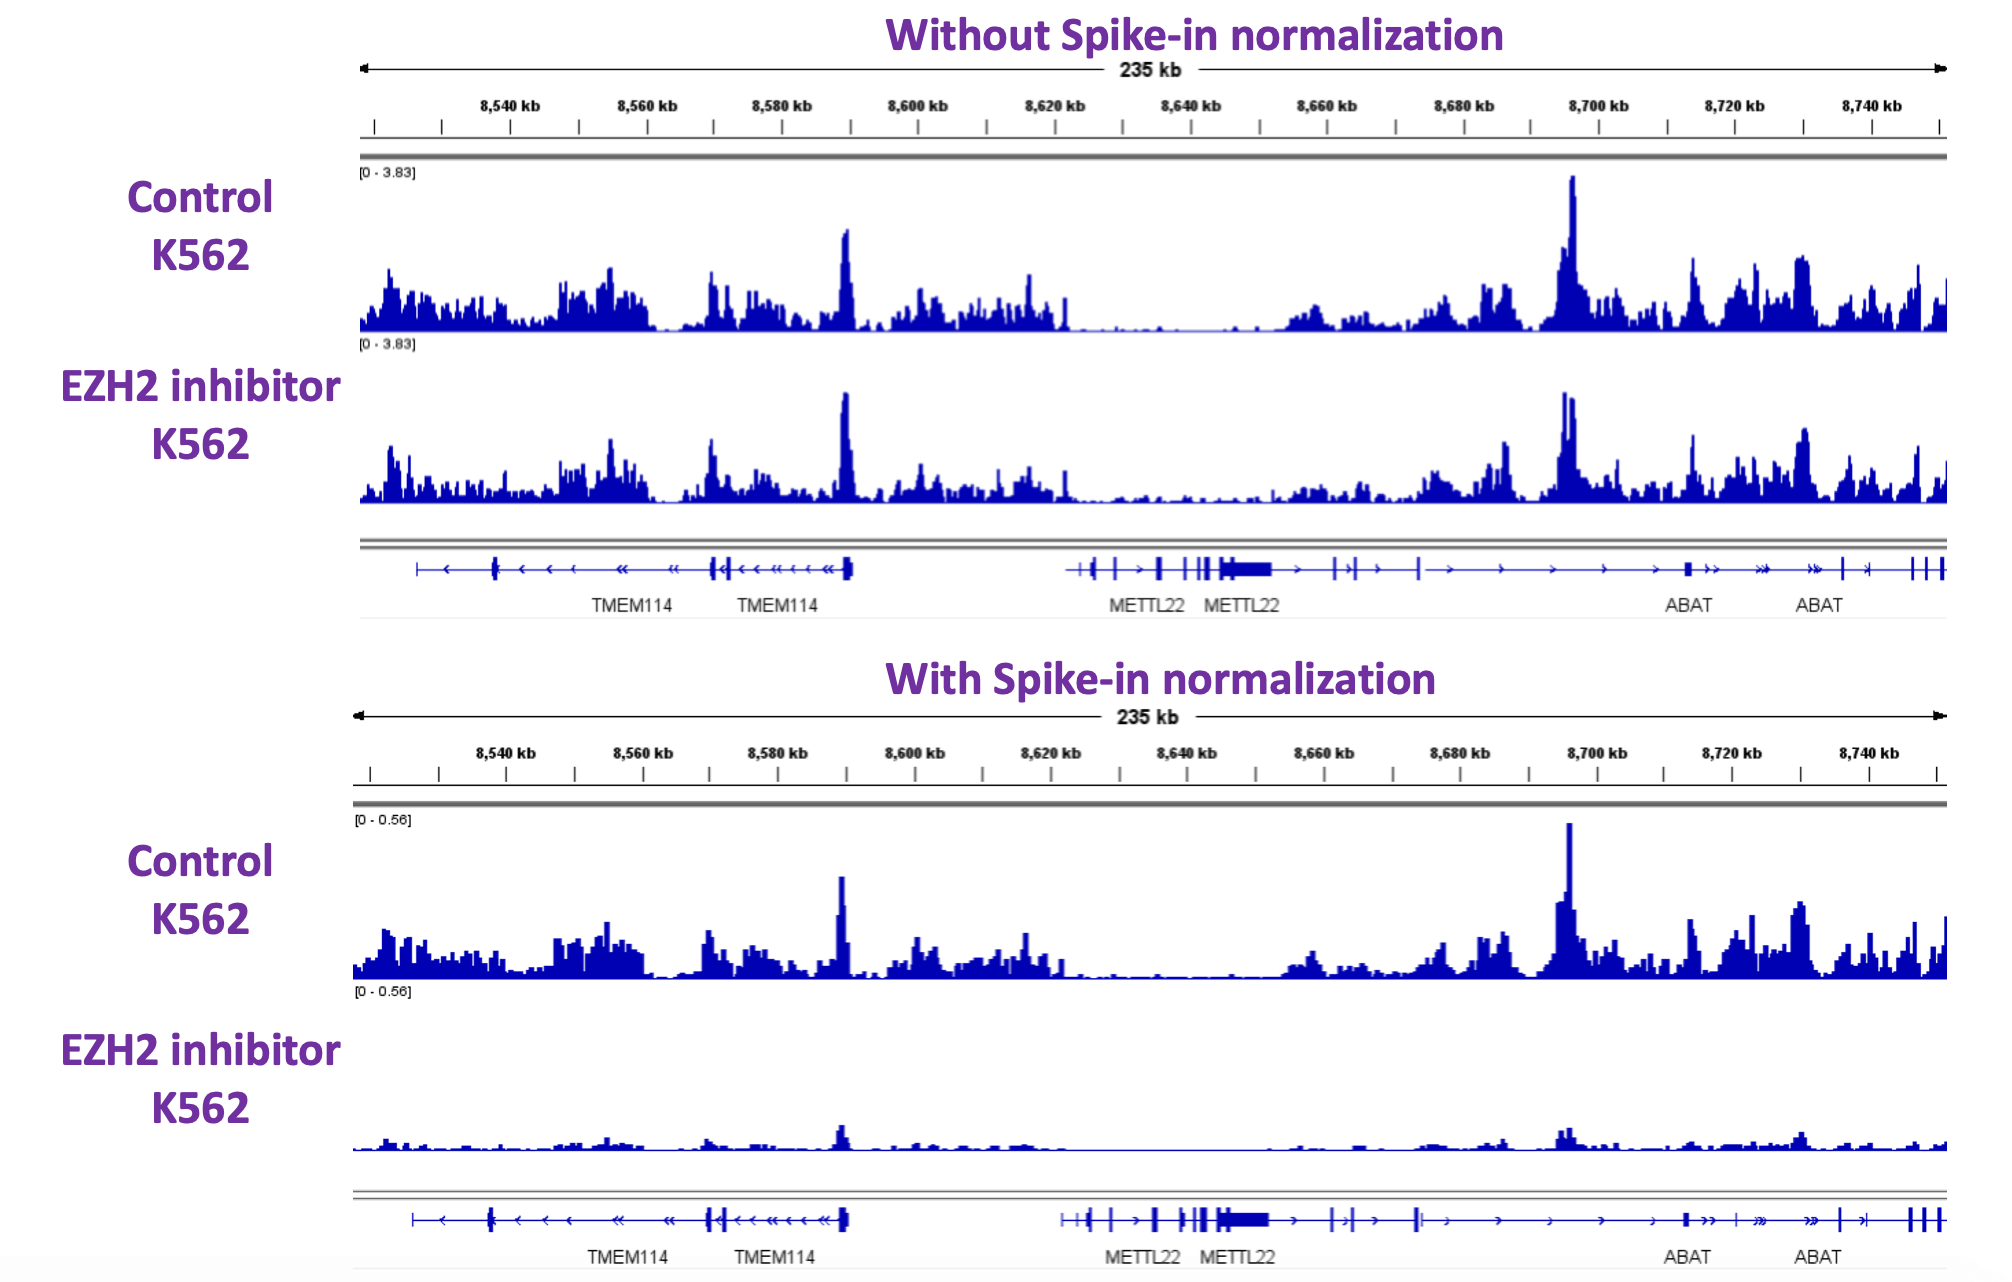
Figure 6. EZH2 inhibition K562 CUT&Tag-IT Assay Results With and Without CUT&Tag-IT Spike-In Control Normalization
IGV browser tracks are shown for control samples and samples treated with an EZH2 inhibitor. Data was analyzed both without and with Spike-in normalization. Global decrease in H3K27me3 histone modification are only detectable with Spike-in normalization.
CUT&Tag-IT Spike-In Control Documents